
Filtering Reports
The Dashboard filter bar lets you narrow the data shown across all sections — summary cards, charts, and breakdown tables all update together when you change a filter. By default, the Dashboard loads with a date filter set to the current month. You can add, modify, or remove filters at any time to focus on the data that matters to you.
Available Filters
| Filter | What It Does | Available To |
|---|---|---|
| Date | Restricts to time entries within a date range or on a specific date. | Everyone |
| Project | Shows only entries for the selected project(s). | Everyone |
| Client | Shows only entries for projects that belong to the selected client(s). | Everyone |
| Service | Shows only entries tagged with the selected service(s). | Everyone |
| Member | Shows only entries logged by a specific team member. | Admins and owners only |
You can combine multiple filters — for example, filtering by a specific client and a date range. All filters are applied together, so only entries matching every active filter are included in the results.
Adding a Filter
The Default Date Filter
Every time you open the Dashboard, a date filter is automatically applied for the current calendar month — from the first day of the month through today. This appears as a compound filter chip (see below) in the filter bar.
To change the date range, click the date filter chip to edit it, or remove it and add a new date filter with a different range.
Compound Filters
A compound filter lets you combine two conditions into a single filter chip using AND or OR logic. The most common use is setting a date range — for example, "Date is on or after Mar 1 AND Date is on or before Mar 31".
How Compound Filters Look
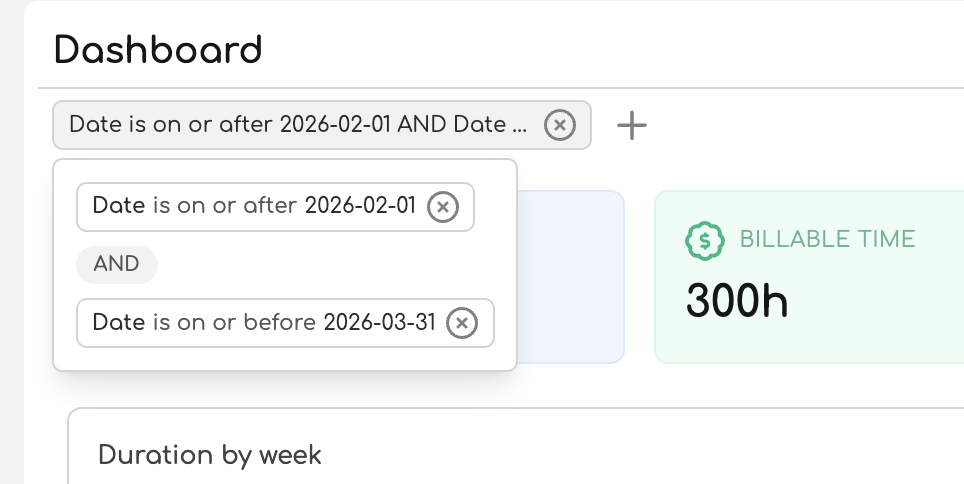
Collapsed: The chip shows a summary of both conditions joined by AND or OR.
Date is on or after Mar 1 AND Date is on or before Mar 31
Expanded: Click the chip to open a popover showing each condition on its own row, with the logic operator (AND/OR) displayed between them.
Creating a Compound Filter
Toggling AND / OR
Click the AND or OR badge between the two conditions to switch between them:
- AND — both conditions must be true. Example: entries on or after Mar 1 and on or before Mar 31 (a date range).
- OR — either condition can be true. Example: entries for Project A or entries for Project B.
Removing Conditions
- To remove a single condition, click the x button on that condition's row inside the expanded chip. If only one condition remains, the compound chip becomes a simple filter chip.
- To remove the entire compound filter, click the x button on the collapsed chip itself.
Limits
Each compound filter group supports a maximum of 2 conditions. The + Filter slot is disabled once both condition slots are filled. If you need more conditions, add a separate filter chip.
Removing Filters
- Remove a single filter: Click the x button on the filter chip.
- Remove all filters: Click the Clear button at the right end of the filter bar.
Removing all filters shows all of your time entries with no date, project, client, service, or member restrictions.
How Filters Affect the Page
Filters are global to the Dashboard — every section responds to the same set of active filters:
| Section | How It Responds |
|---|---|
| Summary cards | Totals, billable time, working days, and daily average recalculate for the filtered entries. |
| Duration chart | The bar chart redraws to show only time within the filtered set. Granularity (daily/weekly/monthly) may change if the date range changes. |
| Distribution chart | The donut chart redraws to show proportions within the filtered entries. |
| Breakdown tables | Rows update to reflect the filtered data, including percentages and totals. |
Filters also persist in the page URL, so you can bookmark or share a filtered view.